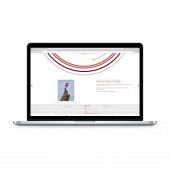
Arab spring Data visualization by Kir Khachaturov

Home > Winners > #34348


DESIGN DETAILS
DESIGN NAME:
Arab spring

PRIMARY FUNCTION:
Data visualization

INSPIRATION:
This project was based on the events taking place in North Africa in 2011. Events which peak of activity took place in the spring and named "Arab Spring". Until the end of 2012 I was very impressed by the news coming out of Africa and I wanted to understand the source of the revolution. And look at the situation as a whole and to represent all by visually understandable language. Collected information was enough for me to show how the events and confrontation developed and what it led to.

UNIQUE PROPERTIES / PROJECT DESCRIPTION:
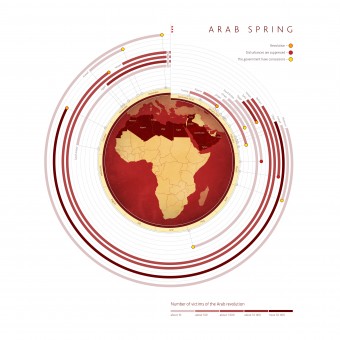
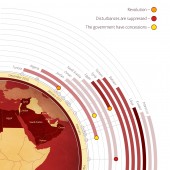
Project is a spiral styled timeline which marked as the beginning and end of the conflict. And at the end of the conflict dates are markers indicating the outcome of the conflict. Saturation of the line is the number of victims of the revolution. So we can observe basic time pattern of historical moments.

OPERATION / FLOW / INTERACTION:
Data visualization is one of the most powerful tools for understanding and analyzing large amounts of data coming from different sources. The key parameters of developing of such data vizualisation should be simplicity and structuring of the original information. Data visualization can be used in a lot of media resources such as the Internet, television and printed to carry and serve as educational function for the viewer in a simple and understandable form.

PROJECT DURATION AND LOCATION:
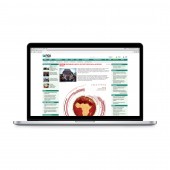
Project was published in 2012 by Russian news agency "RBC"

FITS BEST INTO CATEGORY:
Graphics, Illustration and Visual Communication Design

PRODUCTION / REALIZATION TECHNOLOGY:
The visual part was made by using vector graphics and published on the Internet as the image.

SPECIFICATIONS / TECHNICAL PROPERTIES:
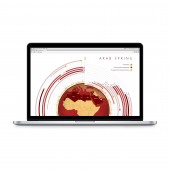
It was developed thinking about a web output subject to technical limitations to publish images.

TAGS:
infographics, data visualization, arab spring, revolution, data, Africa, spiral,

RESEARCH ABSTRACT:
Research of the subject and collecting of information were based on three data sources: BBC, CNN and RBC. During analyzing of the data, were selected basic conflicts indicators which correlated with each other, such as the beginning and end of the revolution, the number of victims and the consequences of the conflict. Thereby were selected data which presents in all conflicts and in all countries where the revolution occurred.

CHALLENGE:
Spiral timeline been chosen not casually. Firstly, the technical limitations imposed by the online publications are not allowed to make a regular horizontally stretched viewer. As well as to compare and analyze the data it is necessary to see the whole picture and in a readable form. Secondly, spiral form based on parallels of the metaphor "Cycled history and development of the history of the spiral".

ADDED DATE:
2014-03-28 04:47:22

TEAM MEMBERS (1) :
Designer - Kir Khachaturov

IMAGE CREDITS:
Image #1: Editor & designer Kir Khachaturov, Arab spring, 2012
Image #2: Designer Kir Khachaturov, Arab spring, 2012
Image #3: Designer Kir Khachaturov, Arab spring, 2012
Image #4: Designer Kir Khachaturov, Arab spring, 2012
Image #5: Designer Kir Khachaturov, Arab spring, 2012


CLIENT/STUDIO/BRAND DETAILS
NAME:
RBC

PROFILE:
The RBC Group operates on the mass media (an information agency, business television channel RBC TV, online newspapers, and marketing communications). RBC's news strategy is based on the principle that only primary sources of information are proven reliable. RBC provides its clients with all necessary information and creates cutting-edge technological ways of delivering it. Our main goal is to foster Russia's integration into the global information and economic community with the help of hi-tech solutions.


NOMINATION DETAILS

Arab Spring Data Visualization by Kir Khachaturov is a Nominee in Graphics, Illustration and Visual Communication Design Category.

· This project is currently confidential as results have not been announced yet. Images and further details of the project is not available for public yet, please check back later. If you are the owner of this design, please login to view the images.

· Click here to register today inorder to be able to view the profile and other works by Kir Khachaturov when results are announced.


AWARD DETAILS

Arab Spring Data Visualization by Kir Khachaturov is Winner in Graphics, Illustration and Visual Communication Design Category, 2013 - 2014.


· Press Members: Login or Register to request an exclusive interview with Kir Khachaturov.

· Click here to register inorder to view the profile and other works by Kir Khachaturov.


SOCIAL
+ Add to Likes / Favorites | Send to My Email | Submit Comment | Comment | Testimonials | View Press-Release | Press Kit | Translations


Did you like Kir Khachaturov's Graphic Design?
You will most likely enjoy other award winning graphic design as well.
Click here to view more Award Winning Graphic Design.


Did you like Arab Spring Data Visualization? Help us create a global awareness for good graphic design worldwide. Show your support for Kir Khachaturov, the creator of great graphic design by gifting them a nomination ticket so that we could promote more of their great graphic design works.

See other A' Design Award and Competition WinnersA' Design Award Presentation Submit Your Designs
 
design award logo

BENEFITS
THE DESIGN PRIZE
WINNERS SERVICES
PR CAMPAIGN
PRESS RELEASE
MEDIA CAMPAIGNS
AWARD TROPHY
AWARD CERTIFICATE
AWARD WINNER LOGO
PRIME DESIGN MARK
BUY & SELL DESIGN
DESIGN BUSINESS NETWORK
AWARD SUPPLEMENT

METHODOLOGY
DESIGN AWARD JURY
PRELIMINARY SCORE
VOTING SYSTEM
EVALUATION CRITERIA
METHODOLOGY
BENEFITS FOR WINNERS
PRIVACY POLICY
ELIGIBILITY
FEEDBACK
WINNERS' MANUAL
PROOF OF CREATION
WINNER KIT CONTENTS
FAIR JUDGING
AWARD YEARBOOK
AWARD GALA NIGHT
AWARD EXHIBITION

MAKING AN ENTRY
ENTRY INSTRUCTIONS
REGISTRATION
ALL CATEGORIES

FEES & DATES
FURTHER FEES POLICY
MAKING A PAYMENT
PAYMENT METHODS
DATES & FEES

TRENDS & REPORTS
DESIGN TRENDS
DESIGNER REPORTS
DESIGNER PROFILES
DESIGN INTERVIEWS

ABOUT
THE AWARD
AWARD IN NUMBERS
HOMEPAGE
AWARD WINNING DESIGNS
DESIGNER OF THE YEAR
MUSEUM OF DESIGN
PRIME CLUBS
SITEMAP
RESOURCE

RANKINGS
DESIGNER RANKINGS
WORLD DESIGN RANKINGS
DESIGN CLASSIFICATIONS
POPULAR DESIGNERS

CORPORATE
GET INVOLVED
SPONSOR AN AWARD
BENEFITS FOR SPONSORS
IMPRESSUM IMPRINT

PRESS
DOWNLOADS
PRESS-KITS
PRESS PORTAL
LIST OF WINNERS
PUBLICATIONS
RANKINGS
CALL FOR ENTRIES
RESULTS ANNOUNCEMENT

CONTACT US
CONTACT US
GET SUPPORT

Good design deserves great recognition.
A' Design Award & Competition.